

Latest#
Demonstrate synoptic.services.Latest
[1]:
from synoptic import Latest

import matplotlib.pyplot as plt
[2]:
df = Latest(
    bbox=[-120, 40, -119, 41],
    showemptystations=True,
    vars="air_temp",
    units="english",
).df()
df
🚚💨 Speedy delivery from Synoptic latest service.
📦 Received data from 12 stations.
[2]:
shape: (12, 20)
| date_time | variable | sensor_index | is_derived | value | units | id | stid | name | elevation | latitude | longitude | mnet_id | state | timezone | elev_dem | period_of_record_start | period_of_record_end | is_restricted | is_active |
|---|---|---|---|---|---|---|---|---|---|---|---|---|---|---|---|---|---|---|---|
| datetime[μs, UTC] | str | u32 | bool | f64 | str | u32 | str | str | f64 | f64 | f64 | u32 | str | str | f64 | datetime[μs, UTC] | datetime[μs, UTC] | bool | bool |
| 2024-11-10 06:37:00 UTC | "air_temp" | 1 | false | 37.0 | "Fahrenheit" | 2169 | "BLUN2" | "BLUEWING MOUNTAIN" | 4570.0 | 40.50147 | -119.12161 | 2 | "NV" | "America/Los_Angeles" | 4655.5 | 1998-07-28 00:00:00 UTC | 2024-11-10 05:37:00 UTC | false | true |
| 2024-11-10 06:59:00 UTC | "air_temp" | 1 | false | 40.0 | "Fahrenheit" | 2171 | "BUFN2" | "BUFFALO CREEK" | 3940.0 | 40.58058 | -119.78881 | 2 | "NV" | "America/Los_Angeles" | 3917.3 | 1998-07-28 00:00:00 UTC | 2024-11-10 05:59:00 UTC | false | true |
| null | null | null | null | null | null | 24903 | "D1623" | "DW1623 Gerlach" | 3947.0 | 40.65133 | -119.35517 | 65 | "NV" | "America/Los_Angeles" | 3950.1 | 2008-11-05 00:00:00 UTC | 2012-11-22 12:44:00 UTC | false | false |
| 2024-11-10 07:00:00 UTC | "air_temp" | 1 | false | 36.0 | "Fahrenheit" | 35321 | "UP973" | "PHIL" | 3998.0 | 40.62174 | -119.41384 | 64 | "NV" | "America/Los_Angeles" | 3930.4 | 2013-01-04 00:00:00 UTC | 2024-11-10 05:22:00 UTC | false | true |
| 2024-11-10 06:36:00 UTC | "air_temp" | 1 | false | 39.0 | "Fahrenheit" | 35322 | "UP974" | "TREGO" | 4005.0 | 40.78996 | -119.07088 | 64 | "NV" | "America/Los_Angeles" | 3937.0 | 2013-01-04 00:00:00 UTC | 2024-11-10 06:12:00 UTC | false | true |
| … | … | … | … | … | … | … | … | … | … | … | … | … | … | … | … | … | … | … | … |
| 2024-11-10 06:28:00 UTC | "air_temp" | 1 | false | 48.0 | "Fahrenheit" | 35347 | "UP999" | "REYNRD" | 3880.0 | 40.53186 | -119.61354 | 64 | "NV" | "America/Los_Angeles" | 3874.7 | 2013-01-04 00:00:00 UTC | 2024-11-10 04:26:00 UTC | false | true |
| 2023-12-18 20:20:00 UTC | "air_temp" | 1 | false | 37.14 | "Fahrenheit" | 41973 | "NHUA" | "Hualapai Flat" | 4055.0 | 40.90111 | -119.33306 | 62 | "NV" | "America/Los_Angeles" | 4081.4 | 2013-12-19 00:00:00 UTC | 2024-01-01 07:20:00 UTC | false | false |
| null | null | null | null | null | null | 57082 | "COOPGERN2" | "GERLACH" | 3954.0 | 40.6517 | -119.3579 | 73 | "NV" | "America/Los_Angeles" | 3927.2 | 2016-07-18 18:18:00 UTC | 2019-05-17 16:00:00 UTC | false | false |
| 2024-11-10 07:00:00 UTC | "air_temp" | 1 | false | 41.0 | "Fahrenheit" | 61916 | "F0371" | "FW0371 Gerlach" | 3953.0 | 40.65176 | -119.35799 | 65 | "NV" | "America/Los_Angeles" | 3963.3 | 2017-02-12 08:19:00 UTC | 2024-11-10 06:00:00 UTC | false | true |
| 2024-11-10 07:00:00 UTC | "air_temp" | 1 | false | 39.0 | "Fahrenheit" | 181031 | "G2749" | "GW2749 Gerlach" | 4028.0 | 40.85933 | -119.34183 | 65 | "NV" | "America/Los_Angeles" | 4022.3 | 2023-01-03 22:09:00 UTC | 2024-11-10 06:15:00 UTC | false | true |
[51]:
fig, ax = plt.subplots(1, 1, figsize=(10, 10))

for i in df.iter_rows(named=True):
    ax.text(
        i["longitude"],
        i["latitude"] + 0.01,
        f'{i["stid"]}\n{i["value"]} F',
        va="bottom",
        ha="left",
    )
    if i["value"] is None:
        art = ax.scatter(
            i["longitude"],
            i["latitude"],
            color=None,
            ec="k",
            s=100,
        )
    else:
        art = ax.scatter(
            i["longitude"],
            i["latitude"],
            c=i["value"],
            ec="k",
            cmap="Spectral_r",
            vmin=20,
            vmax=80,
            s=100,
        )
plt.colorbar(art, ax=ax, location="bottom", pad=0.05, label="Air Temperature (F)")
[51]:
<matplotlib.colorbar.Colorbar at 0x7f03762f5670>
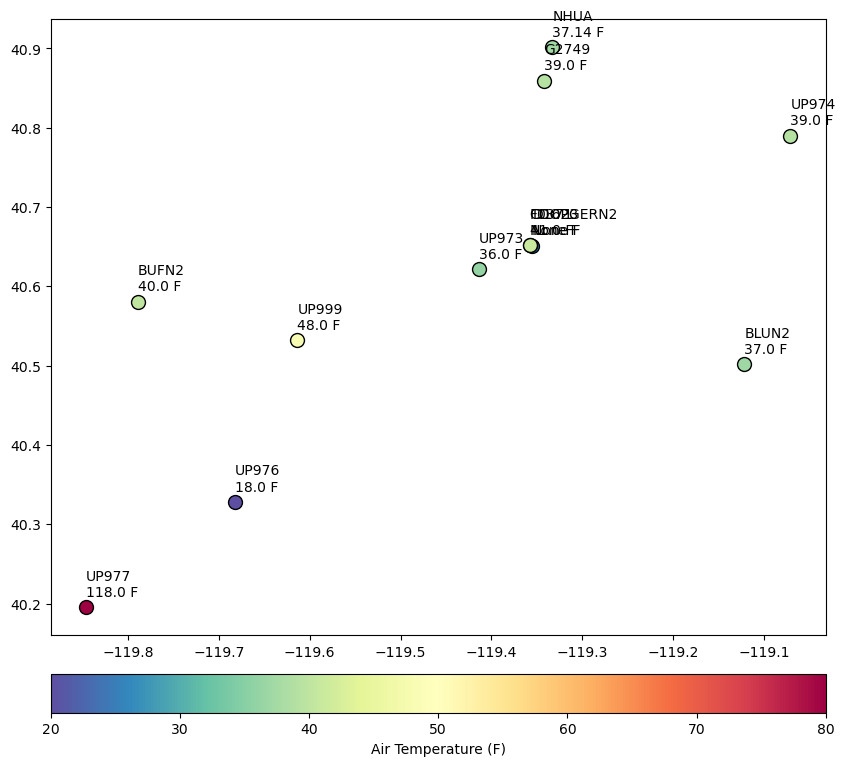
Whoa, there is a station reporting 118 degree F and another reporting 18 F.