Metadata#
Demonstrate the Synoptic Metadata service with SynopticPy.
[1]:
from datetime import datetime

import polars as pl
import seaborn as sns
import matplotlib.pyplot as plt

import matplotlib.pyplot as plt

plt.rcParams["font.sans-serif"] = "Mona-Sans"  # or 'Hubot-Sans
plt.rcParams["font.monospace"] = "Fira Code"

import synoptic
from herbie.toolbox import EasyMap, pc, ccrs
/home/blaylock/miniconda3/envs/synoptic2/lib/python3.12/site-packages/pyproj/__init__.py:89: UserWarning: pyproj unable to set database path.
  _pyproj_global_context_initialize()
Synoptic’s station metadata service allows you to get just the metadata of stations you are interested in and filter based on station selection parameters.
Let’s start by getting metadata from good ‘ol trusty WBB…
[2]:
s = synoptic.Metadata(stid="wbb")
s.df()
🚚💨 Speedy delivery from Synoptic metadata service.
📦 Received data from 1 stations.
[2]:
| id | stid | name | elevation | latitude | longitude | mnet_id | state | timezone | elev_dem | period_of_record_start | period_of_record_end | is_restricted | is_active |
|---|---|---|---|---|---|---|---|---|---|---|---|---|---|
| u32 | str | str | f64 | f64 | f64 | u32 | str | str | f64 | datetime[μs, UTC] | datetime[μs, UTC] | bool | bool |
| 1 | "WBB" | "U of U William Browning Buildi… | 4806.0 | 40.76623 | -111.84755 | 153 | "UT" | "America/Denver" | 4727.7 | 1997-01-01 00:00:00 UTC | 2024-11-11 22:20:00 UTC | false | true |
We can also get all the stations in Utah that report air temperature, but only those that reported air temp since January 1, 2024. To make things interesting (and to showcase Poalrs), lets sort by the stations with the longest period of record.
After looking at the result, I wouldn’t take too much stock in Synoptics period-of-record database. It has errors like some stations with records back to 1970 (if you tried getting data that far back Synoptic will tell you the “Query start and/or end time outside valid time range” error) and some stations have end dates after start dates.
[3]:
s = synoptic.Metadata(state="UT", vars="air_temp", obrange=datetime(2024, 1, 1))

df = (
    s.df()
    .with_columns(
        duration_of_record=pl.col("period_of_record_end")
        - pl.col("period_of_record_start")
    )
    .sort("duration_of_record", descending=True)
)
df
🚚💨 Speedy delivery from Synoptic metadata service.
📦 Received data from 1,377 stations.
[3]:
| id | stid | name | elevation | latitude | longitude | mnet_id | state | timezone | elev_dem | period_of_record_start | period_of_record_end | is_restricted | is_active | duration_of_record |
|---|---|---|---|---|---|---|---|---|---|---|---|---|---|---|
| u32 | str | str | f64 | f64 | f64 | u32 | str | str | f64 | datetime[μs, UTC] | datetime[μs, UTC] | bool | bool | duration[μs] |
| 58745 | "COOPFISU1" | "FISH SPRINGS NWR" | 4357.0 | 39.8401 | -113.3978 | 73 | "UT" | "America/Denver" | 4357.0 | null | null | false | false | null |
| 63187 | "UCL21" | "PelicanLake - Agrimet PELU" | 4820.0 | 40.17422 | -109.66659 | 26 | "UT" | "America/Denver" | 4822.8 | 1970-01-01 00:00:00 UTC | 2024-11-11 22:15:00 UTC | false | true | 20038d 22h 15m |
| 63191 | "UCL25" | "Monroe - Agrimet MNRU" | 5404.0 | 38.63411 | -112.15766 | 26 | "UT" | "America/Denver" | 5278.9 | 1970-01-01 00:00:00 UTC | 2024-11-11 22:15:00 UTC | false | true | 20038d 22h 15m |
| 63192 | "UCL26" | "CastleValley - Agrimet CSVU" | 4685.0 | 38.64793 | -109.39925 | 26 | "UT" | "America/Denver" | 4701.4 | 1970-01-01 00:00:00 UTC | 2024-11-11 22:15:00 UTC | false | true | 20038d 22h 15m |
| 2329 | "BSTU1" | "BRIMSTONE RESERVOIR" | 5620.0 | 38.30733 | -113.38619 | 2 | "UT" | "America/Denver" | 5629.9 | 1997-01-01 00:00:00 UTC | 2024-11-11 22:25:00 UTC | false | true | 10176d 22h 25m |
| … | … | … | … | … | … | … | … | … | … | … | … | … | … | … |
| 251182 | "PC595" | "Bluff" | 4368.0 | 37.28918 | -109.55899 | 247 | "UT" | "America/Denver" | null | 2024-11-06 19:30:00 UTC | 2024-11-11 22:20:00 UTC | false | true | 5d 2h 50m |
| 251284 | "PC597" | "Huntington SW" | 5816.0 | 39.31449 | -110.98184 | 247 | "UT" | "America/Denver" | null | 2024-11-08 19:40:00 UTC | 2024-11-11 22:20:00 UTC | false | true | 3d 2h 40m |
| 251289 | "PC598" | "Catamount" | 8323.0 | 38.82905 | -111.62334 | 247 | "UT" | "America/Denver" | null | 2024-11-09 07:40:00 UTC | 2024-11-11 22:20:00 UTC | false | true | 2d 14h 40m |
| 59704 | "COOPGUNU1" | "GUNLOCK PH" | 4110.0 | 37.2805 | -113.7283 | 77 | "UT" | "America/Denver" | 4107.6 | 2016-08-01 16:38:00 UTC | 2016-07-31 14:00:00 UTC | false | false | -1d -2h -38m |
| 48319 | "LEGCY" | "Legacy Prep Academy" | 4249.0 | 40.8676 | -111.91678 | 12 | "UT" | "America/Denver" | 4252.0 | 2016-02-08 21:33:00 UTC | 2016-02-02 19:30:00 UTC | false | false | -6d -2h -3m |
All Stations#
It takes a few seconds, but you can get metadata for all Synoptic stations.
[4]:
%%time
s = synoptic.Metadata()
🚚💨 Speedy delivery from Synoptic metadata service.
📦 Received data from 103,529 stations.
CPU times: user 1.71 s, sys: 2.63 s, total: 4.34 s
Wall time: 18 s
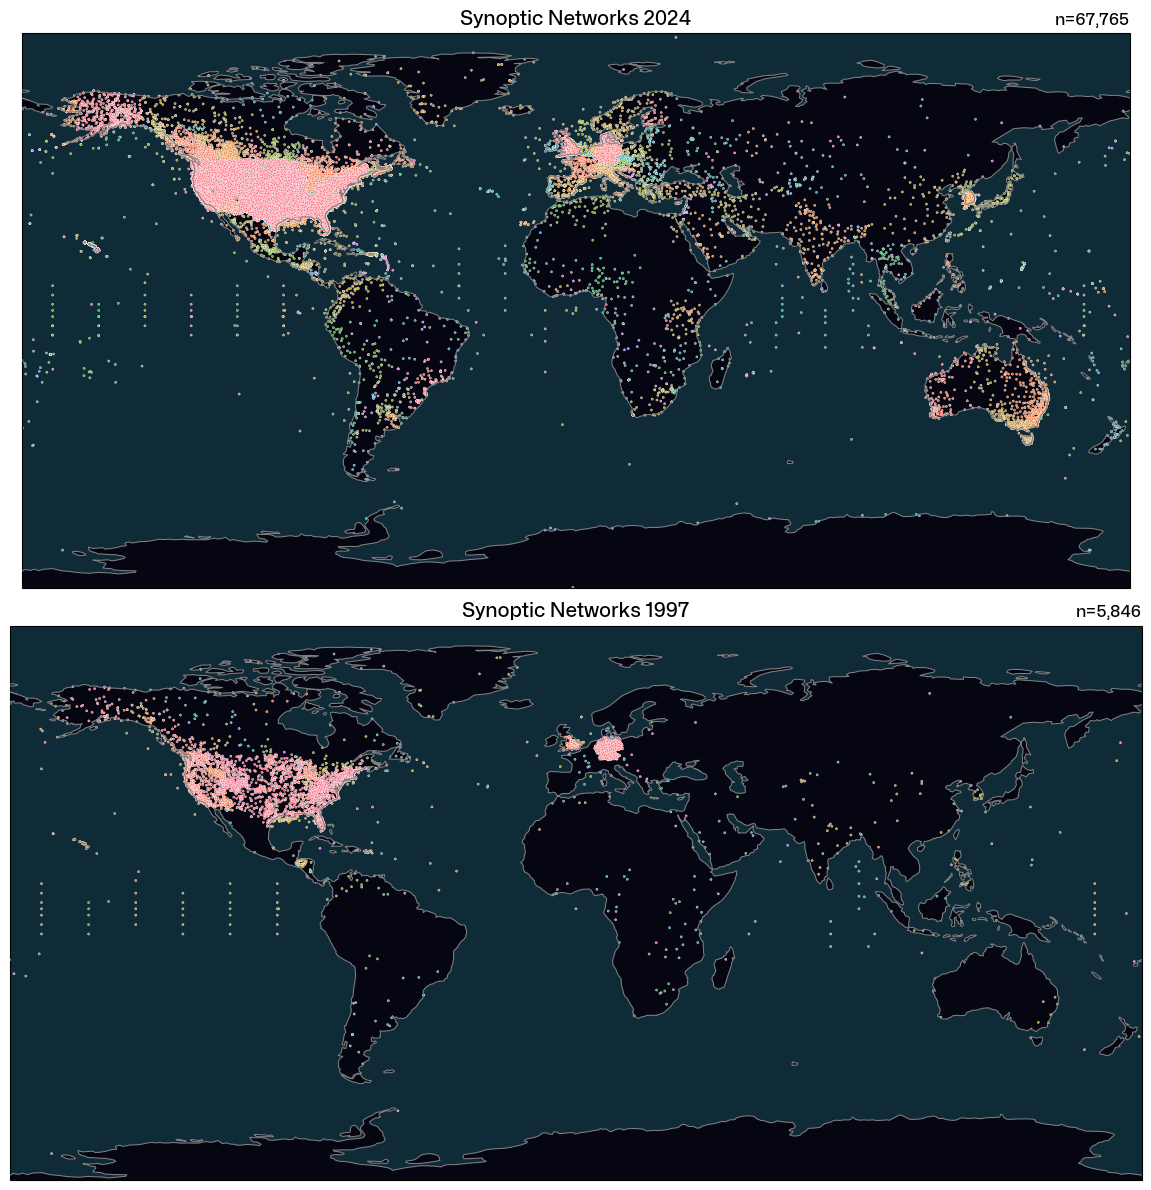
Let’s plot the location of all those stations, and color them by timezone. Just for fun, let’s also plot what available data existed in 1997. Of course, all this information is only as good as the metadata really is.
[5]:
in_2024 = synoptic.Metadata(obrange=datetime(2024, 1, 1)).df()
in_1997 = synoptic.Metadata(obrange=(datetime(1997, 1, 1), datetime(1998, 1, 1))).df()

fig, (ax1, ax2) = plt.subplots(2, 1, subplot_kw=dict(projection=pc))

for ax in (ax1, ax2):
    EasyMap(ax=ax, theme="dark", figsize=(12, 12)).OCEAN()

sns.scatterplot(
    in_2024.unique(["latitude", "longitude"]),
    ax=ax1,
    x="longitude",
    y="latitude",
    hue="timezone",
    legend=False,
    marker=".",
    s=10,
)

sns.scatterplot(
    in_1997.unique(["latitude", "longitude"]),
    ax=ax2,
    x="longitude",
    y="latitude",
    hue="timezone",
    legend=False,
    marker=".",
    s=10,
)

ax1.set_title("Synoptic Networks 2024", fontsize="x-large")
ax1.set_title(f"n={len(in_2024):,}", loc="right")

ax2.set_title("Synoptic Networks 1997", fontsize="x-large")
ax2.set_title(f"n={len(in_1997):,}", loc="right")

plt.tight_layout()
🚚💨 Speedy delivery from Synoptic metadata service.
📦 Received data from 67,765 stations.
🚚💨 Speedy delivery from Synoptic metadata service.
📦 Received data from 5,846 stations.
/home/blaylock/miniconda3/envs/synoptic2/lib/python3.12/site-packages/seaborn/_core/data.py:313: SettingWithCopyWarning: modifications to a method of a datetimelike object are not supported and are discarded. Change values on the original.
  return pd.api.interchange.from_dataframe(data)
/home/blaylock/miniconda3/envs/synoptic2/lib/python3.12/site-packages/seaborn/_core/data.py:313: SettingWithCopyWarning: modifications to a method of a datetimelike object are not supported and are discarded. Change values on the original.
  return pd.api.interchange.from_dataframe(data)
/home/blaylock/miniconda3/envs/synoptic2/lib/python3.12/site-packages/seaborn/_core/data.py:313: SettingWithCopyWarning: modifications to a method of a datetimelike object are not supported and are discarded. Change values on the original.
  return pd.api.interchange.from_dataframe(data)
/home/blaylock/miniconda3/envs/synoptic2/lib/python3.12/site-packages/seaborn/_core/data.py:313: SettingWithCopyWarning: modifications to a method of a datetimelike object are not supported and are discarded. Change values on the original.
  return pd.api.interchange.from_dataframe(data)
/home/blaylock/miniconda3/envs/synoptic2/lib/python3.12/site-packages/seaborn/_core/data.py:313: SettingWithCopyWarning: modifications to a method of a datetimelike object are not supported and are discarded. Change values on the original.
  return pd.api.interchange.from_dataframe(data)
/home/blaylock/miniconda3/envs/synoptic2/lib/python3.12/site-packages/seaborn/_core/data.py:313: SettingWithCopyWarning: modifications to a method of a datetimelike object are not supported and are discarded. Change values on the original.
  return pd.api.interchange.from_dataframe(data)
PG&E Stations#
[6]:
df = synoptic.Metadata(network=229).df()
df
🚚💨 Speedy delivery from Synoptic metadata service.
📦 Received data from 1,582 stations.
[6]:
| id | stid | name | elevation | latitude | longitude | mnet_id | state | timezone | elev_dem | period_of_record_start | period_of_record_end | is_restricted | is_active |
|---|---|---|---|---|---|---|---|---|---|---|---|---|---|
| u32 | str | str | f64 | f64 | f64 | u32 | str | str | f64 | datetime[μs, UTC] | datetime[μs, UTC] | bool | bool |
| 65233 | "PG002" | "Highland Peak Road" | 2487.0 | 37.81296 | -121.80534 | 229 | "CA" | "America/Los_Angeles" | 2490.2 | 2018-05-11 22:07:00 UTC | 2024-11-11 19:40:00 UTC | false | true |
| 65234 | "PG003" | "Page Mill Road" | 2230.0 | 37.32591 | -122.18035 | 229 | "CA" | "America/Los_Angeles" | 2217.8 | 2018-05-11 22:07:00 UTC | 2024-11-11 22:20:00 UTC | false | true |
| 65235 | "PG004" | "Loma Prieta Road" | 2964.0 | 37.09883 | -121.85796 | 229 | "CA" | "America/Los_Angeles" | 2956.0 | 2018-05-11 22:07:00 UTC | 2024-11-11 22:20:00 UTC | false | true |
| 65236 | "PG005" | "Franz Valley Road" | 1060.0 | 38.56465 | -122.68386 | 229 | "CA" | "America/Los_Angeles" | 1059.7 | 2018-05-11 22:07:00 UTC | 2024-11-11 22:20:00 UTC | false | true |
| 65237 | "PG006" | "Hogback Road" | 1033.0 | 37.91166 | -122.57871 | 229 | "CA" | "America/Los_Angeles" | 971.1 | 2018-05-11 22:24:00 UTC | 2024-11-11 22:20:00 UTC | false | true |
| … | … | … | … | … | … | … | … | … | … | … | … | … | … |
| 246840 | "492PG" | "French Bridge" | 4113.0 | 39.24268 | -122.84953 | 229 | "CA" | "America/Los_Angeles" | null | 2024-10-14 23:40:00 UTC | 2024-11-11 22:20:00 UTC | false | true |
| 247836 | "578PG" | "West Sacramento" | 8.0 | 38.50707 | -121.57904 | 229 | "CA" | "America/Los_Angeles" | null | 2024-10-21 23:50:00 UTC | 2024-11-11 22:20:00 UTC | false | true |
| 247862 | "616PG" | "Arroyo Seco Campground" | 875.0 | 36.23525 | -121.48049 | 229 | "CA" | "America/Los_Angeles" | null | 2024-10-22 20:40:00 UTC | 2024-11-11 22:10:00 UTC | false | true |
| 247869 | "581PG" | "Dos Palos" | 110.0 | 36.97466 | -120.63433 | 229 | "CA" | "America/Los_Angeles" | null | 2024-10-24 02:40:00 UTC | 2024-11-11 22:20:00 UTC | false | true |
| 251183 | "615PG" | "Lower Tunitas Creek Road" | 556.0 | 37.37129 | -122.35965 | 229 | "CA" | "America/Los_Angeles" | null | 2024-11-06 17:40:00 UTC | 2024-11-11 22:10:00 UTC | false | true |
[7]:
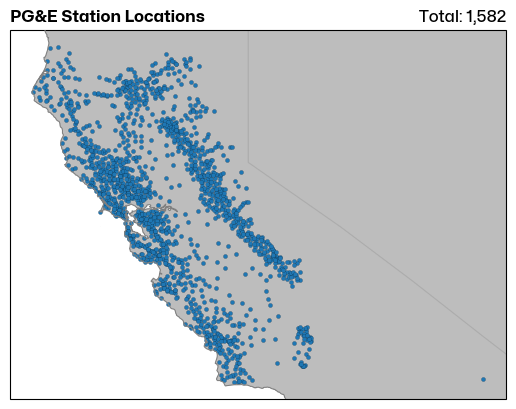
ax = EasyMap("10m", theme="grey").OCEAN().STATES().ax

ax.scatter(df["longitude"], df["latitude"], marker=".", ec="k", lw=0.1)
ax.set_title("PG&E Station Locations", loc="left", fontweight="bold")
ax.set_title(f"Total: {len(df):,}", loc="right")
[7]:
Text(1.0, 1.0, 'Total: 1,582')
[8]:
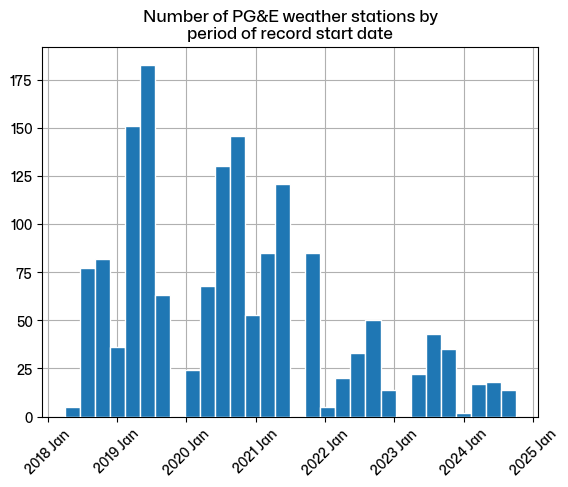
from matplotlib.dates import DateFormatter

plt.hist(df["period_of_record_start"].dt.round("3mo"), bins=30, ec="w", zorder=10)
plt.grid()

plt.gca().tick_params(axis="x", labelrotation=45)
date_form = DateFormatter("%Y %b")
plt.gca().xaxis.set_major_formatter(date_form)

plt.title("Number of PG&E weather stations by\nperiod of record start date")
[8]:
Text(0.5, 1.0, 'Number of PG&E weather stations by\nperiod of record start date')